GIS for Business Analytics
Table of contents
Chapter 2Geocoding and Visualizing
GIS solutions for everyone
Understanding the evolution of a software, particularly when it represents a leading technology which has brought so much over the last decades, is of great importance to gain a concise understanding of it until present. Most software’s face a constant pushing and pulling of more processing capabilities versus improved network bandwidths. It is in this process that often innovation occurs, and new versions of software suites build and improve on functions and ways to cope with certain issues. The advances of software thus help to answer prompts by businesses, science, and society in general, promoting the finding of more efficient solutions that help even construct a better society.
But how does society reap the benefits of technological advance? Well, it all starts with the individual, capable of using a given software and hardware, and using it often for specific tasks whether in their daily life or in their professional environment. In this sense, we can say that software pertains a set of computer instructions, nested together to allow an easier workflow to achieve certain tasks and results. It deals thus with data and clear sets of instructions, which are programmed into the software and allow for a given response. We can claim that anything that can be stored electronically, is, software, while everything that cannot be electronically stored but is the container of said storage is what we call hardware. Software and hardware are thus interrelated components.
Geographic Information Systems (GIS) go a step further beyond this heuristic definition, as they do not only integrate hardware and software, but further allow to capture, manage, analyse and display geographically referenced information. In this sense, the components of hardware and software that create GIS, lead to a better society and support technological advance as tools that allow finding relations between geographical patterns, create and inform of given spatial trends and solve problems of environment, society and economy. It is the spatial component that makes GIS so special, and with the present advances of open data, that is, data sources freely available for everyone to download, sharing and representing data becomes increasingly a geographical attribute.
QGIS is such a software, and has evolved a lot over the recent years. Originally named Quantum GIS, QGIS is a cross-platform open-source Geographic Information System software, providing an integrated platform for spatial data manipulation, analysis and viewing. Similar to commercial software, it allows to create spatial features and maps, conveying different projection types and integrating raster and vector layers. One of the key characteristics of open source GIS software is the ability to integrate a wider range of data, contrary to commercial GIS software. Developed in 2002 by Gary Sherman, QGIS was incorporated in the Open Source Geospatial Foundation in 2007. The Open Source Geospatial Foundation presently embeds a series of GIS software applications such as QGIS, GRASS GIS, OSSIM, Marble and gvSIG.
The ability of QGIS to run in different operating systems, makes QGIS particularly interesting for the Mac user, as leading commercial GIS software is predominantly designed to operate on Microsoft Windows. Another great advantage of QGIS is its low maintenance regarding processing power, making QGIS a light weight GIS software which due to its cross-platform characteristics makes it an ubiquitous software that runs independently on operating system, extending nowadays even the integration to mobile devices running Android. The community driven environment of QGIS is also felt in the over forty languages QGIS has been translated to. Users are welcome to join the QGIS initiative as translators contributing to the translation efforts of the software.
The QGIS Interface
-
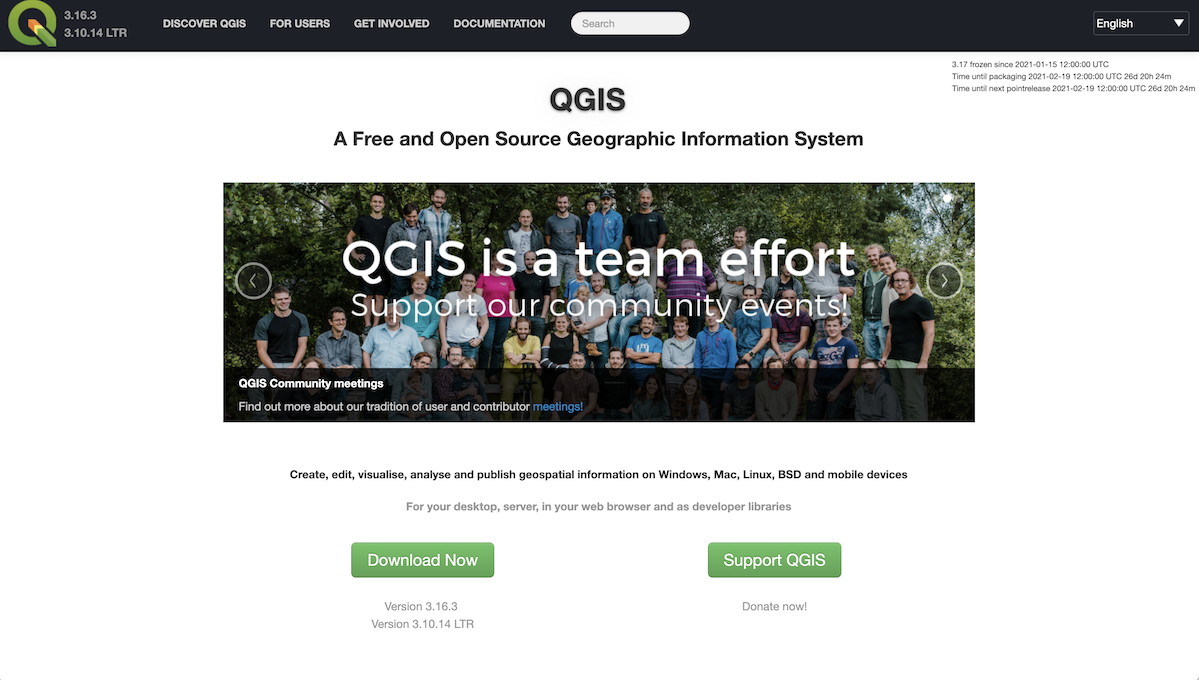
The installers are available on the QGIS website. QGIS updates its version regularly, so it is recommended that you regularly check the QGIS website for updates. The current version is QGIS 3.16.3 'Hannover' and was released on 15.01.2021. The long-term repositories currently offer QGIS 3.10.14 'A Coruña'. QGIS is available on Windows, macOS, Linux and Android. Proceed with downloading and installing the software.
Once you have successfully initialized QGIS, you will see a welcome message with “QGIS Tips”. Close this window, but do not unselect the checkbox, as many of the upcoming tips may be useful.
Start a new document at the upper left corner. The QGIS Graphical User Interface (GUI) is organized as to offer the maximum visibility and the most functionality through existing toolbars and categories. While the GUI can be personalized depending on the QGIS users need, the default should consist of the basic item that allow the user to add and manage spatial data efficiently. Let’s look at the left side and analyse the different panels.
-
The Browser panel holds all the directories so you can navigate to the folders. You may also add your directories as “Favourites” allowing easy access to data and to projects you are working on. You can also organize the location of your Browser panel to your convenience, and interchange between the different tabs
-
Another important toolbar that you will be extensively using is the Manage Layer Tool bar. It is through this toolbar, or through the menu, that you will be able to add different data sources. Note that you can hover over the icons and see what they allow you to do. This proves to be particularly useful should you be uncertain what a specific button does.
Location of toolbars and other components may be configured to the users liking and as to expedite the most efficient workflow. Toolbars which are widely used during the manipulation of data in QGIS, can be dragged and dropped as to allow the user a more personalized GUI to work with. Given the many different tools available in QGIS, this personalization is very useful, as it helps the user to have a more efficient and productive working environment.
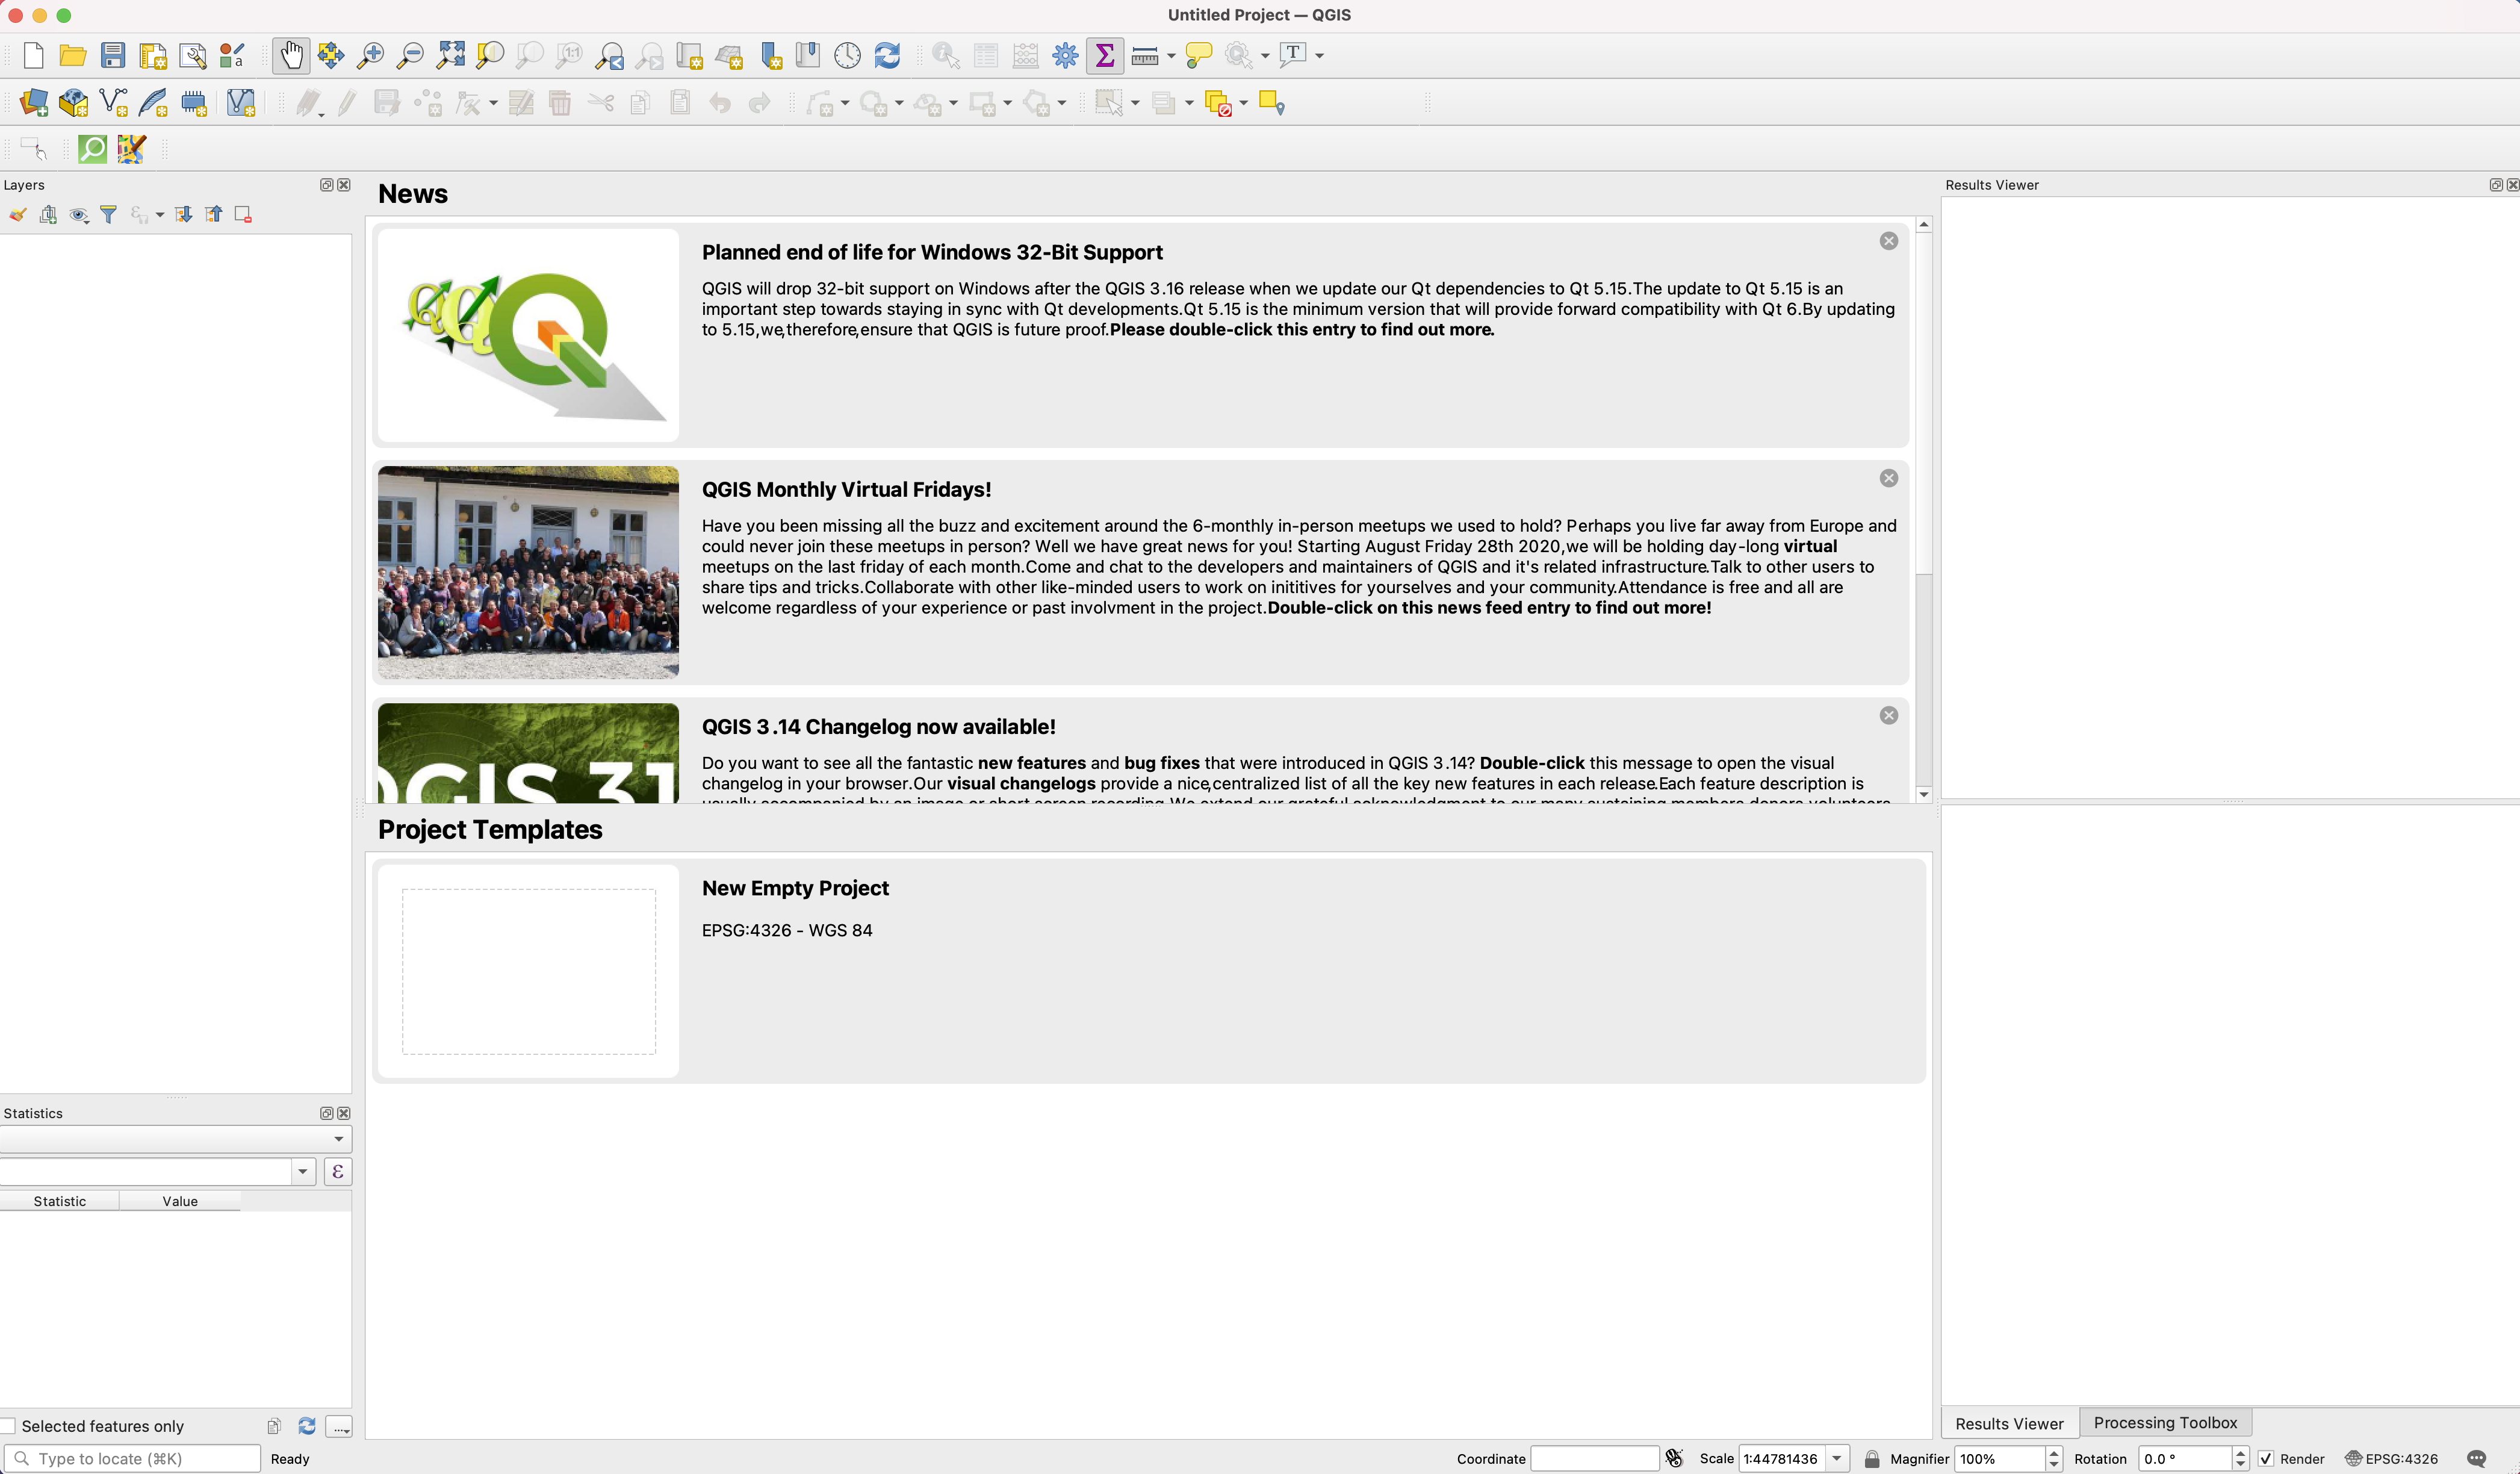
The QGIS Graphical User Interface (GUI) is organized as to offer the maximum visibility and the most functionality through existing toolbars and categories. While the GUI can be personalized depending on the QGIS users need, the default should consist of the basic item that allow the user to add and manage spatial data efficiently. Let’s look at the left side and analyse the different panels.